
How to Make Charts and Reports from Gravity Forms Entries
Updated November 10, 2026 · 3 min read
How many people registered this week? Which T-shirt size is most popular? How much has the fundraiser raised, and how many requests are still open? Your Gravity Forms entries already hold the answers. The trick is seeing them without exporting a spreadsheet every time.
This guide covers Gravity Forms’ built-in numbers, the export route, and how to put live charts and totals on a page.
What Gravity Forms can do on its own
- Form stats. The Forms list shows each form’s views, entries and conversion rate.
- Results for polls, surveys and quizzes. The official Polls, Survey and Quiz add-ons include results views for their own fields, and polls can show results to people after they vote.
- Entries screen and export. You can filter entries and export them to CSV.
For anything else (totals of a Number field, entries per month, a breakdown of one field by another) the usual route is exporting to a spreadsheet and building charts there. Those charts are out of date the moment the next entry arrives.
The code route
A developer can query entries with GFAPI::get_entries() or GFAPI::count_entries(), total them in PHP, and pass the numbers to a charting library. Each chart is its own little project, and every new question (“can we split that by team?”) means more code.
The no-code route: KodaDash chart blocks
KodaDash boards include blocks that count, total and chart entries live, every time the page loads. You can put them on a page for your team, your board of directors, or the public.
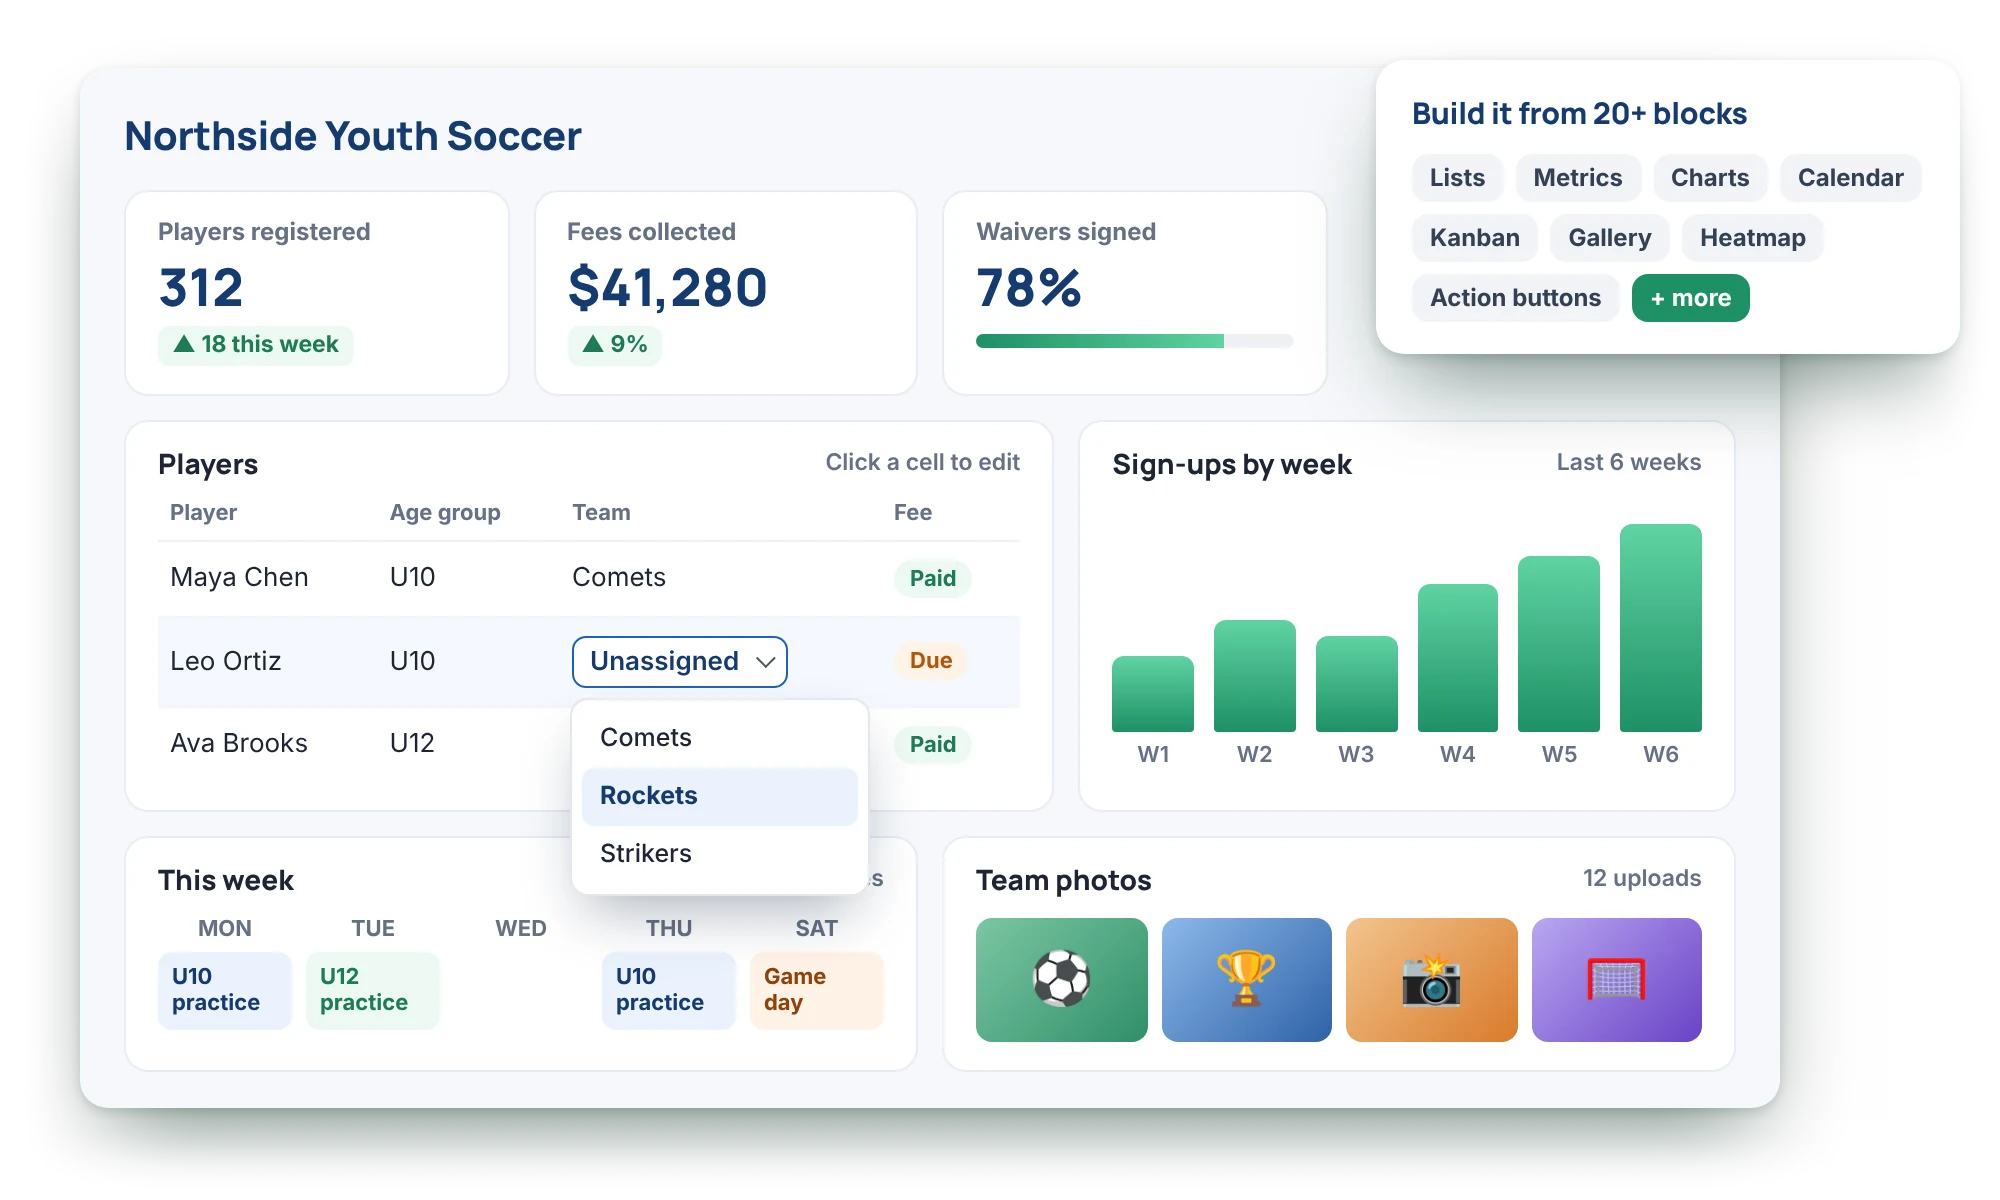
Metric: one number
The Metric block shows a single value, such as Registrations: 128 or Raised: $12,450. It can:
- Count entries on any form.
- Sum, average, or find the largest or smallest value of a Number field.
- Show the earliest or latest date.
- Count or list the different values in a field, such as how many schools are represented.
Add currency symbols, decimals, thousands separators and text before or after the number.
Simple Chart: one field
The Simple Chart block charts one field: registrations by size, requests by status, or entries per month. Choose bar, column, donut, pie, line or one of several radial styles. It can count entries or sum, average, or find the minimum or maximum of another field, and date fields can be grouped by day, week, month or year. Show only the top five, rename groups, and pick each one’s colour.
Comparison Chart: one field by another
The Comparison Chart block shows how one field breaks down across another, like Status by Month or T-shirt size by Team. Stacked or grouped bars and columns, diverging bars, lines and stacked areas are all there.
Heatmap: activity over time
The Heatmap block shows entries as a grid of coloured squares, like a contributions calendar: darker squares mean busier days. It’s a quick way to see seasonal patterns or which weekdays are busiest.
Filters make one board answer many questions
Every block has its own filter, so a chart can show only paid registrations or only this term. Board-wide filters add a bar visitors can switch between, such as This week, This month or My team, and every chart and number on the board follows. Relative ranges like “last 30 days” are worked out fresh each time the board loads.
Each block also has a Visibility tab, so financial totals can show only to managers while everyone else sees the attendance chart.
Which route should you take?
- Poll, survey or quiz results only: the official add-ons’ results views may be all you need.
- A one-off report: export to CSV and chart it in a spreadsheet.
- Numbers and charts that stay up to date, on a page people can visit: use KodaDash chart blocks.
See live metrics and charts on a demo board on the KodaDash page, or read about the chart blocks in the docs.